
Purpose
The Metric Complete Date drop-down arrow filters average metric cycle times based on the selected date. Upon selecting a Metric Complete Date from the drop-down menu, the corresponding average metric cycle time for that date becomes visible on the dashboard page.
Note:
The Trend Chart shows the metrics for the last 12 months by default. They can change this as per their needs.
Prerequisites
Installed Package(s): CQ QMI - Summer 2026
Product: CQ QMI
Function: Creating Rating Models
User Profile: Standard User
Permissions: CQ Base User PSG, CQ QMI Manager PSG
Steps
-
From the Control Tower Analytics Dashboard, click the Metric Complete Date drop-down arrow.
Example:
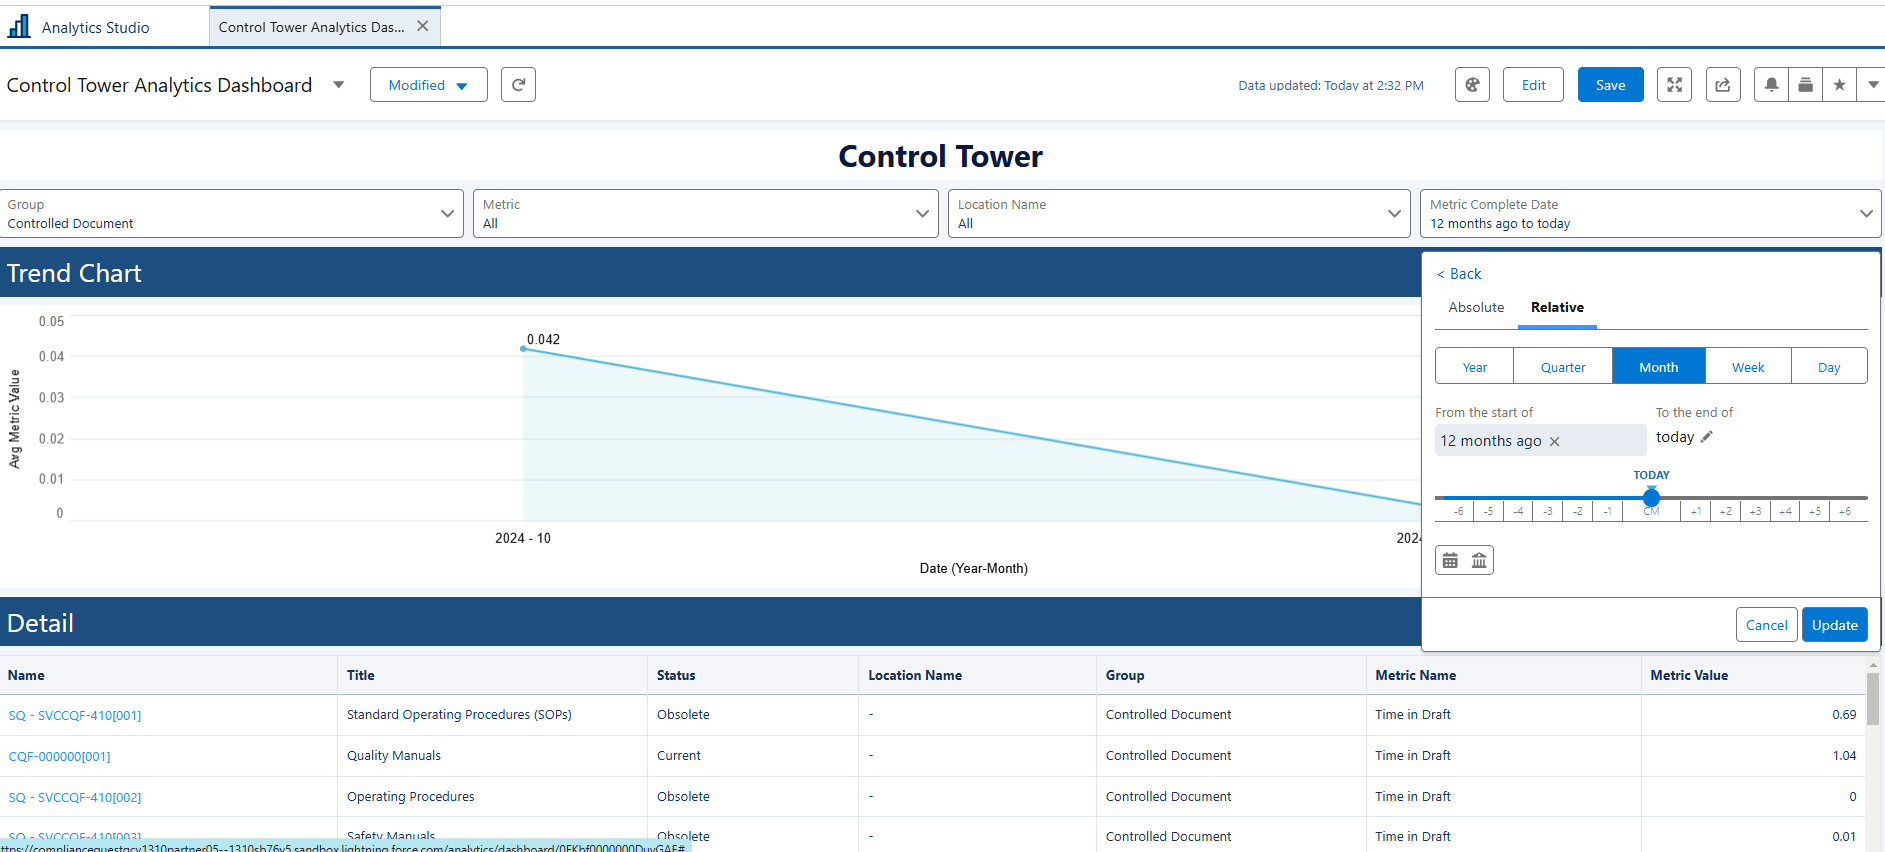
-
Select the Absolute or Relative tab.
-
Select any applicable values and click the Update button.
Expected Outcome
-
The Trend Chart updates to display a line graph illustrating how the average metric value changes over time for the selected Metric Complete Date.
-
The Detail section refreshes to show a list of all records associated with the selected date, allowing users to review the specific entries that contribute to the displayed trend.
Troubleshooting
Optional Configurations
Additional Resources
ComplianceQuest