
Purpose
As a Record Owner, you view automatically calculated metrics through the MDR Dashboard. You open the dashboard and review the displayed metrics to understand reporting values generated from complaint and device data.
Prerequisites
Installation Package: CQ Core, CQ Regulatory Reports Extension, CQ AS2 Gateway Extension, myCQ Extension, and CQ AI Extension
Product: QualityQuest and Platform Apps
Function: CQ MDR Analytics Dashboard Access
User Profile: Standard User
Permissions: CQ Base User PSG, CQ Complaint Regulatory Owner PSG
Steps
-
From the App Launcher, search and select Analytics Studio, click the Browse button, select Dashboards, and click the MDR Dashboard.
-
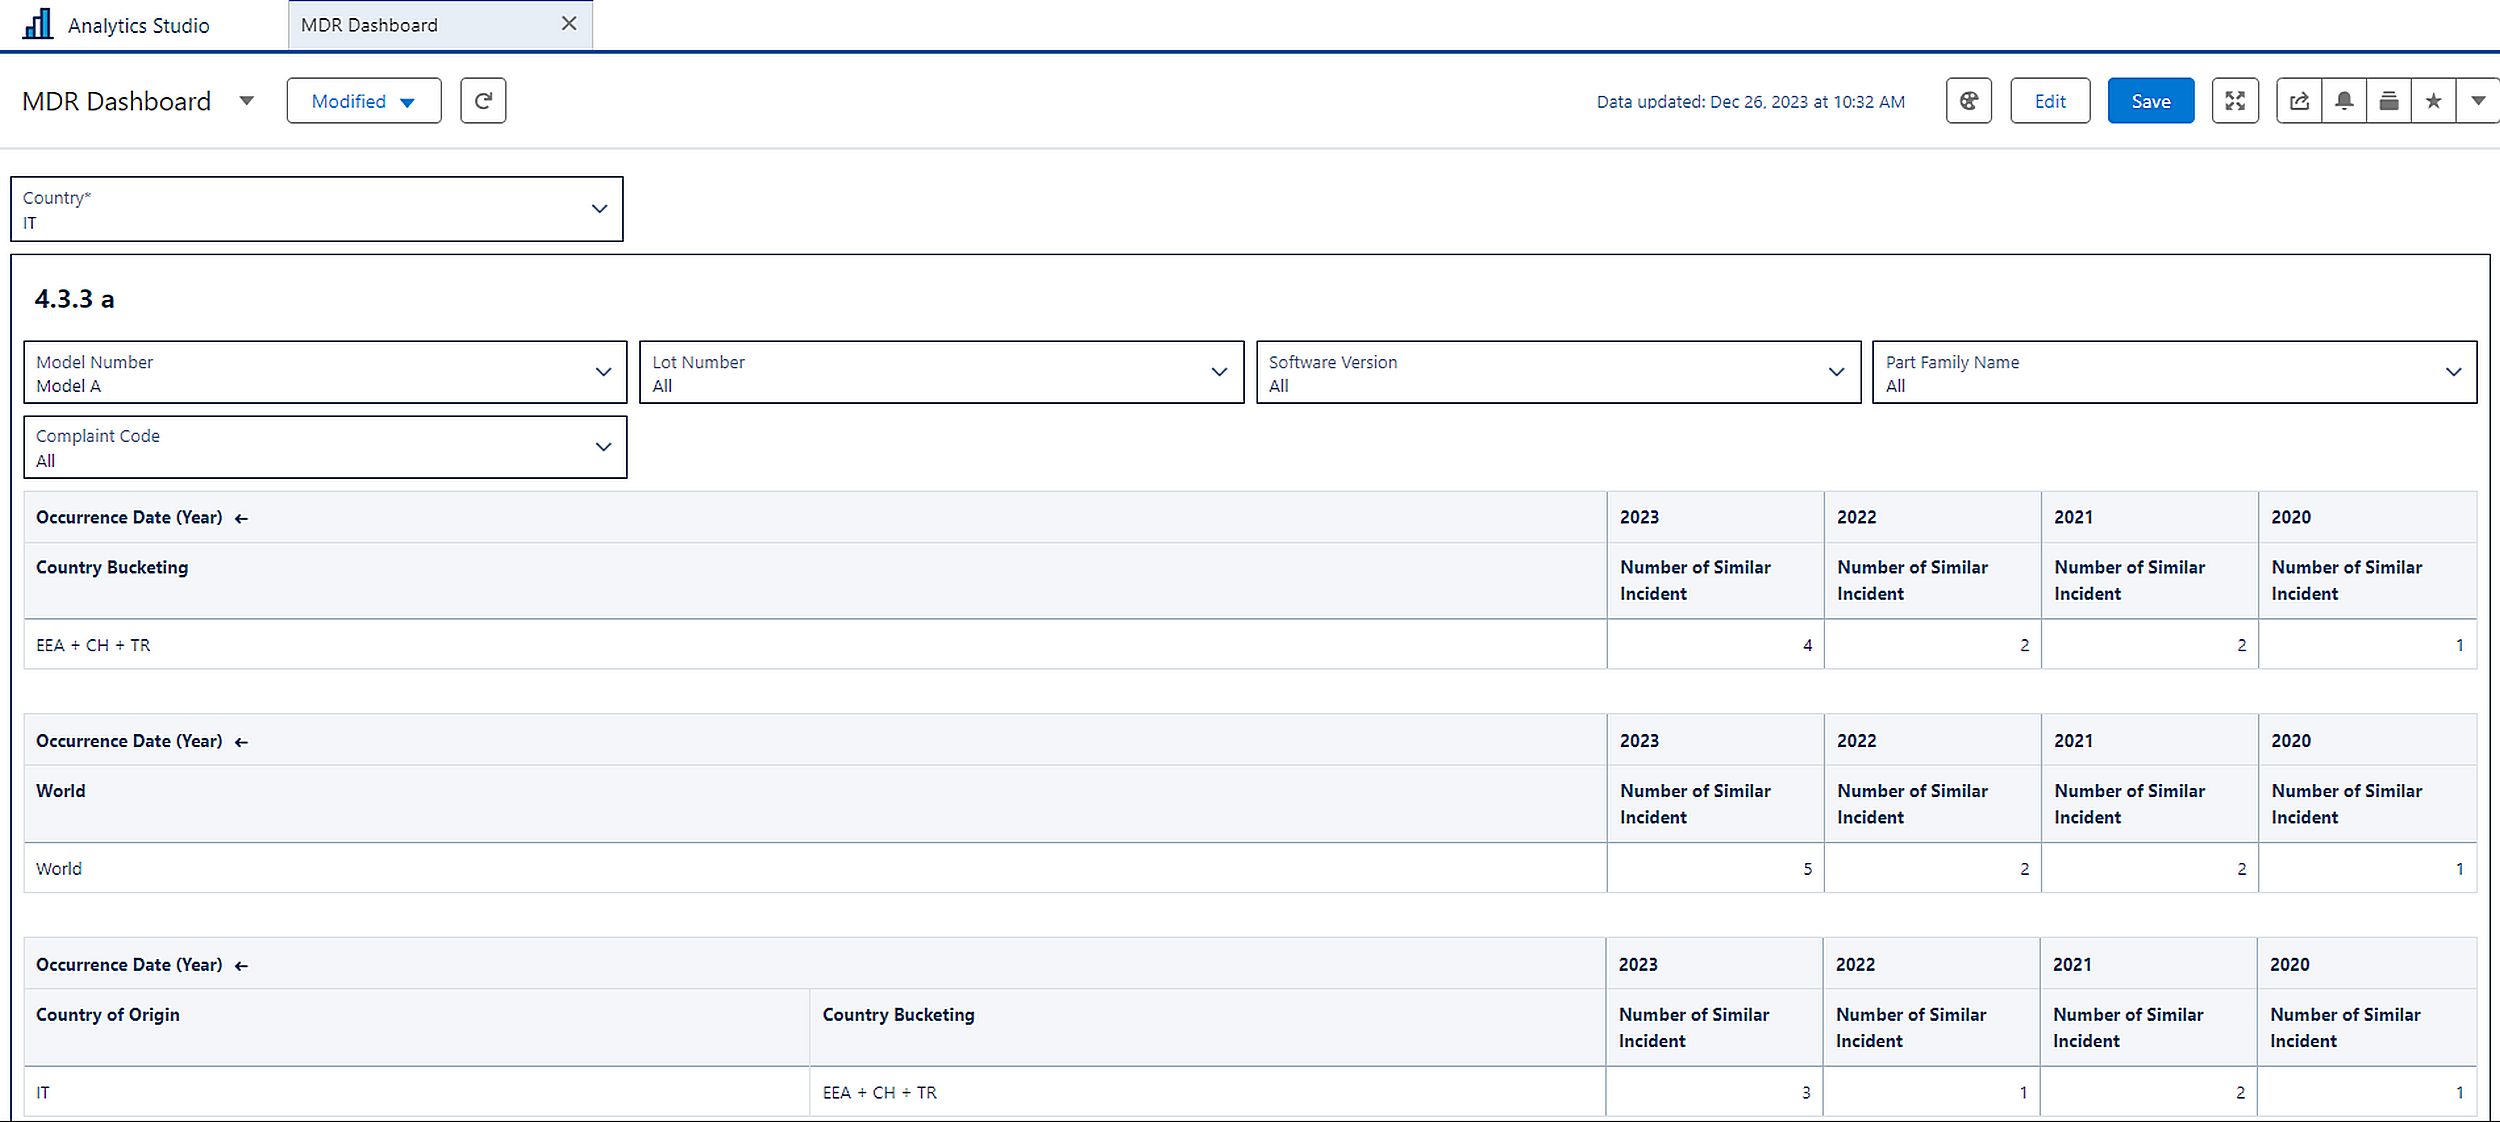
Select the Country was used while creating the Complaint record.
4.3.3 a
-
Optionally, select the Model Number that was used while creating the Complaint record.
-
Optionally, select the Lot Number that was used while creating the Complaint record.
-
Optionally, select the Complaint Code that was used while creating the Complaint record.
-
Optionally, select the Software Version that was used while creating the Complaint record.
-
Optionally, select the Part Family Name that was used while creating the Complaint record.
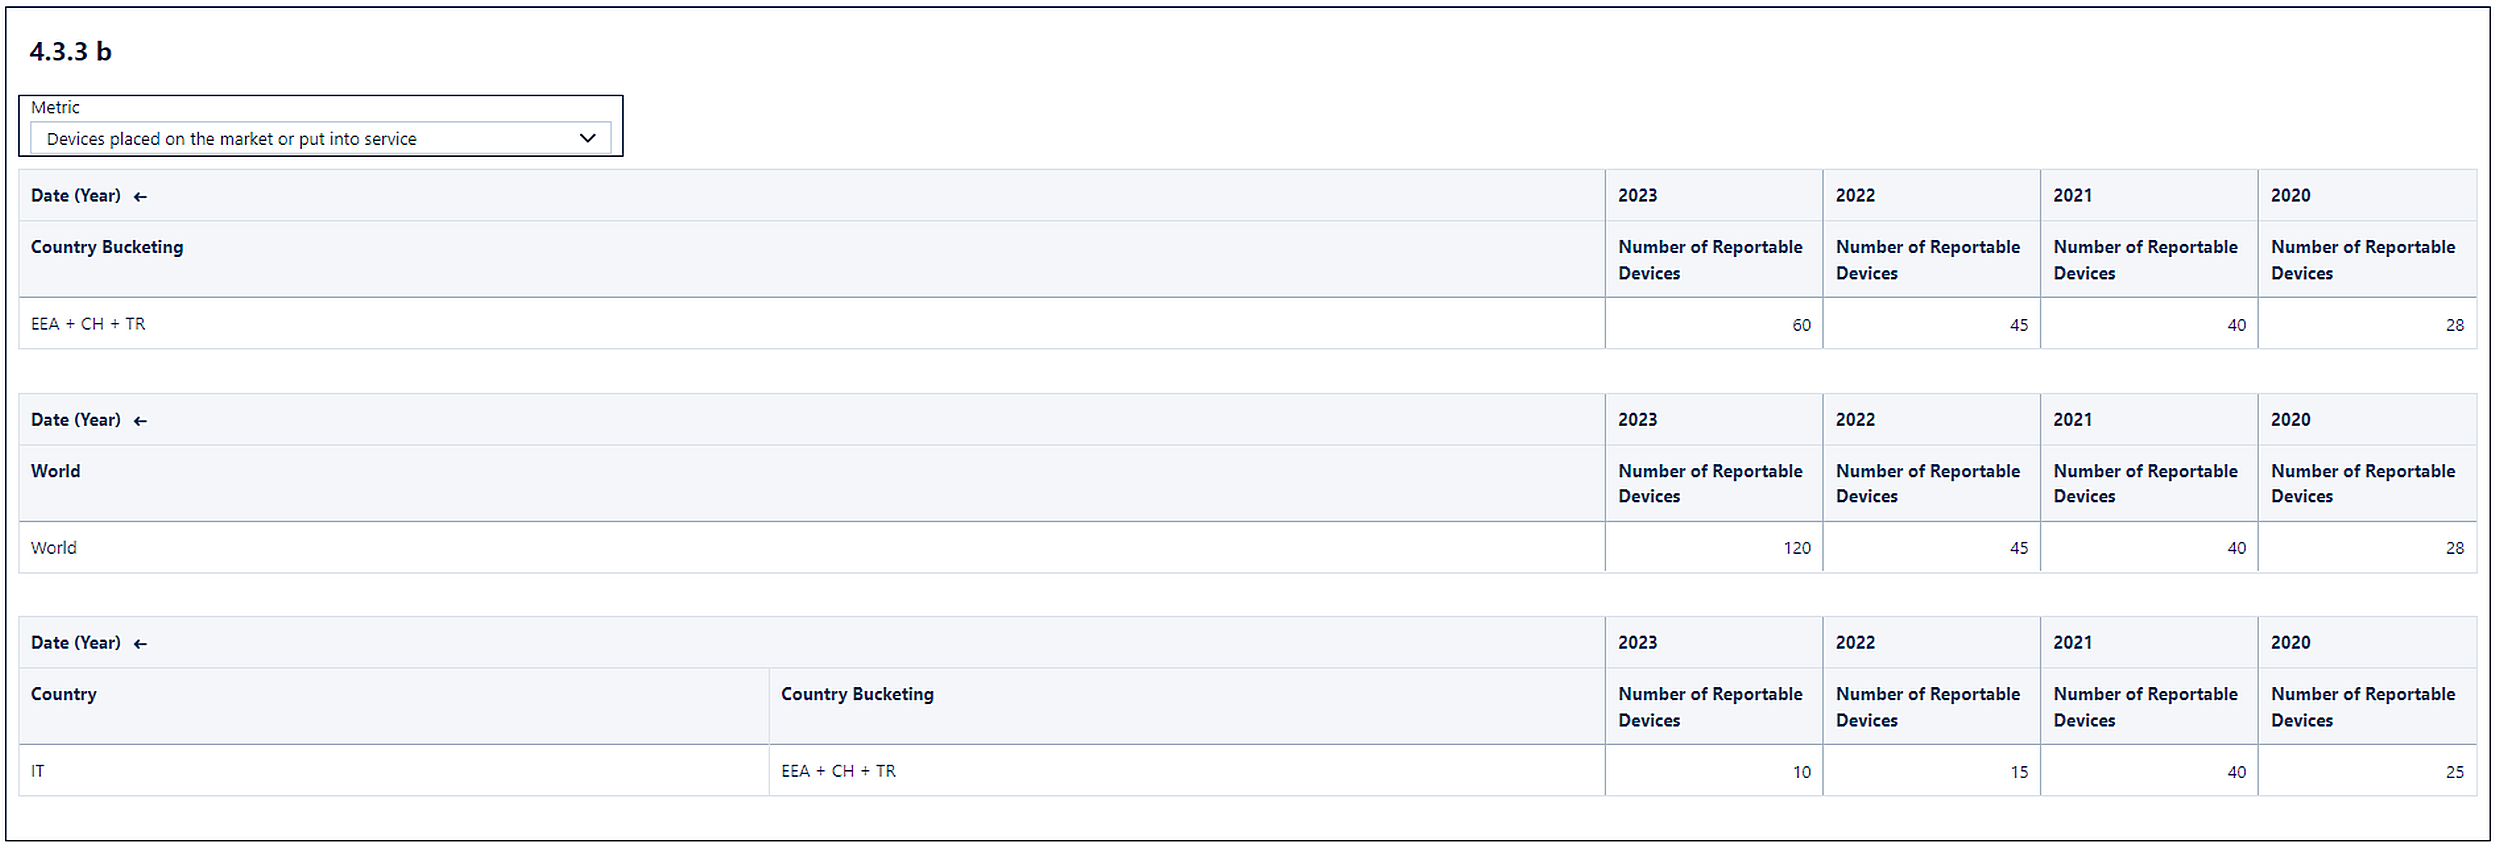
4.3.3 b
-
Optionally, select a Metric that was used while creating the Regulatory Report.
Example:
4.3.3 a
4.3.3 b
Expected Outcome
-
In 4.3.3 a, the Number of Similar Incidents is displayed for the selected Country, EEA+CH+TR, and the World for different Occurrence Date (Year).
-
In 4.3.3 b, the Number of Reportable Devices is displayed for the selected Country, EEA+CH+TR, and the World for different Date (Year).
-
All the values in 4.3.3 a and 4.3.3 b are similar to the values displayed in the 4.3.3 c section of the Regulatory Report.
We Value Your Feedback
To provide feedback or suggestions to improve the help content on this page click here