
Purpose
As a Record Owner, you view the Analytics Dashboard for Complaints to review charts and metrics that show complaint trends. You examine the available data to understand volumes, patterns, or changes that may support evaluation or follow‑up actions.
Prerequisites
Installation Package: CQ Core, CQ Regulatory Reports Extension, CQ AS2 Gateway Extension, myCQ Extension, and CQ AI Extension
Product: QualityQuest and Platform Apps
Function: CQ Complaint Analytics Dashboard Access
User Profile: Standard User
Permissions: CQ Base User PSG, CQ Complaint Owner PSG, and CQ EA Permission
Steps
-
From the Complaint record, click the Analytics tab.
-
Select the Part, i.e., (All or any Part available). Click the Apply button.
-
Select the Part Family, i.e., (All or any Part Family available). Click the Apply button.
-
Select the Complaint Code, i.e., (All or any Complaint Code available). Click the Apply button.
-
Select the Conclusion Code, i.e., (All or any Conclusion Code available). Click the Apply button.
-
Select the Failure Code, i.e., (All or any Failure Code available). Click the Apply button.
-
Select the Failure Category, i.e., (All or any Failure Category available). Click the Apply button.
-
Select the Lookback Period (i.e., All or Custom).
-
Select the Interval i.e., (Month or Week).
Example:
Expected Outcome
-
For Interval as Month
-
In the Count sub-section under the Occurrence section, the total count of Complaint report which are not voided is displayed with the Time Interval of Month in the line graph format.
-
Horizontal line displays the Time of occurrence, whereas the vertical line shows the count of that respective time.
-
Occurrence is displayed based on a monthly interval.
-
It displays the Complaint Occurrence count as selected based on the Lookback Period. If the Look Period is selected as 12 months ago to today means it will display the Complaint occurrence record from 12 months ago to today.
-
If there is no Occurrence of a Complaint for the mentioned Part, then the count for that time interval is displayed as 0.
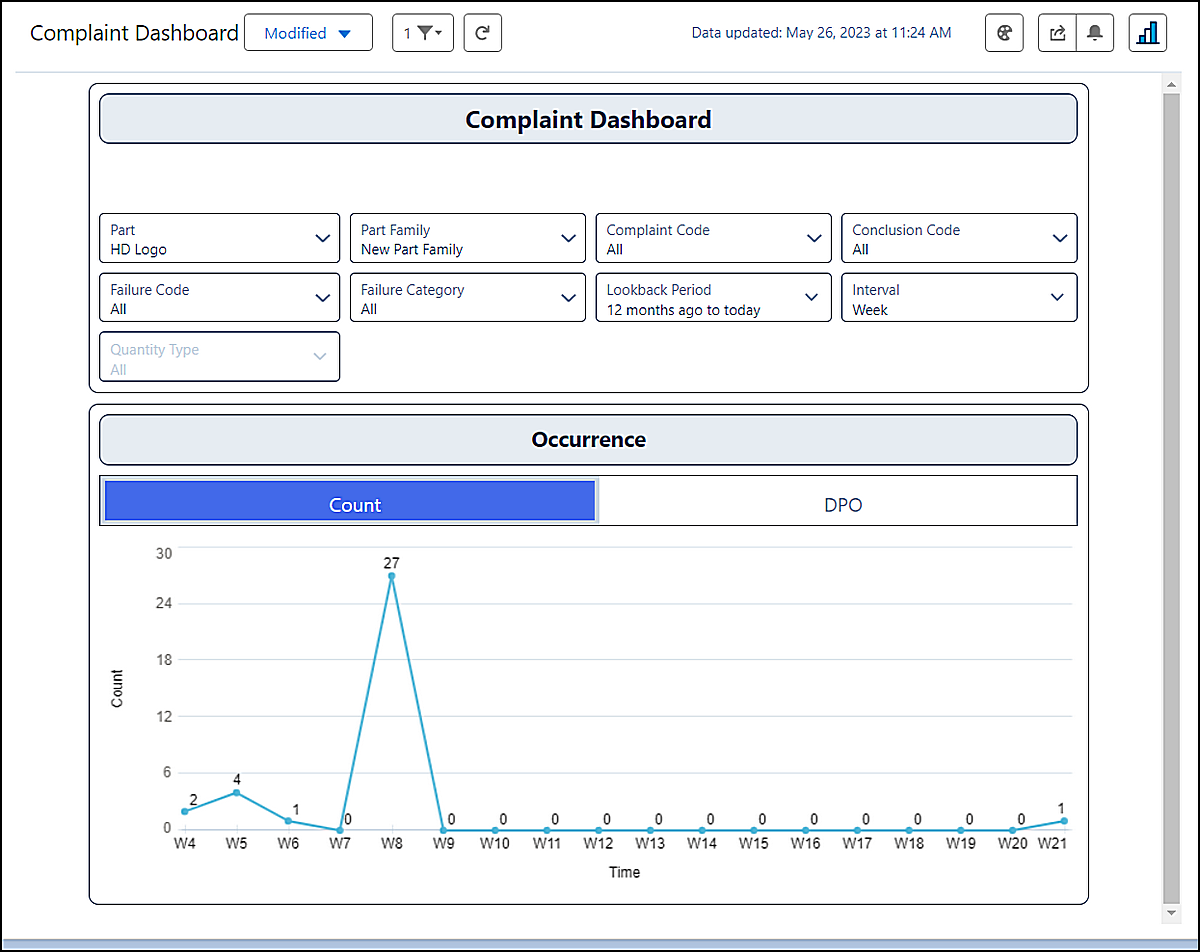
For Interval as Week
-
In the Count sub-section under the Occurrence section, the total count of Complaint report which are not voided is displayed with the Time Interval of Month in the line graph format.
-
Horizontal line displays the Time of occurrence, whereas the vertical line shows the count of that respective time.
-
Occurrence is displayed based on a weekly interval.
-
It displays the Complaint Occurrence count as selected based on the Lookback Period. If the Look Period is selected as 12 months ago to today means it will display the Complaint occurrence record from 12 months ago to today.
-
If there is no Occurrence of a Complaint for the mentioned Part, then the count for that time interval is displayed as 0.
-
Additional Resources
ComplianceQuest
We Value Your Feedback
To provide feedback or suggestions to improve the help content on this page click here.