
Purpose
As a Dashboard User, you can filter average metric cycle times by CQ module to view only relevant data. This task supports focused analysis and informed decisions by showing module‑specific cycle time results on the dashboard.
Prerequisites
Installed Package(s): CQ Core, CQ QMI - Summer 2026
Product: Platform & Technology
Function: Control Tower Dashboard
User Profile: Standard User
Permissions: CQ Base User PSG, CQ QMI Manager PSG
Steps
-
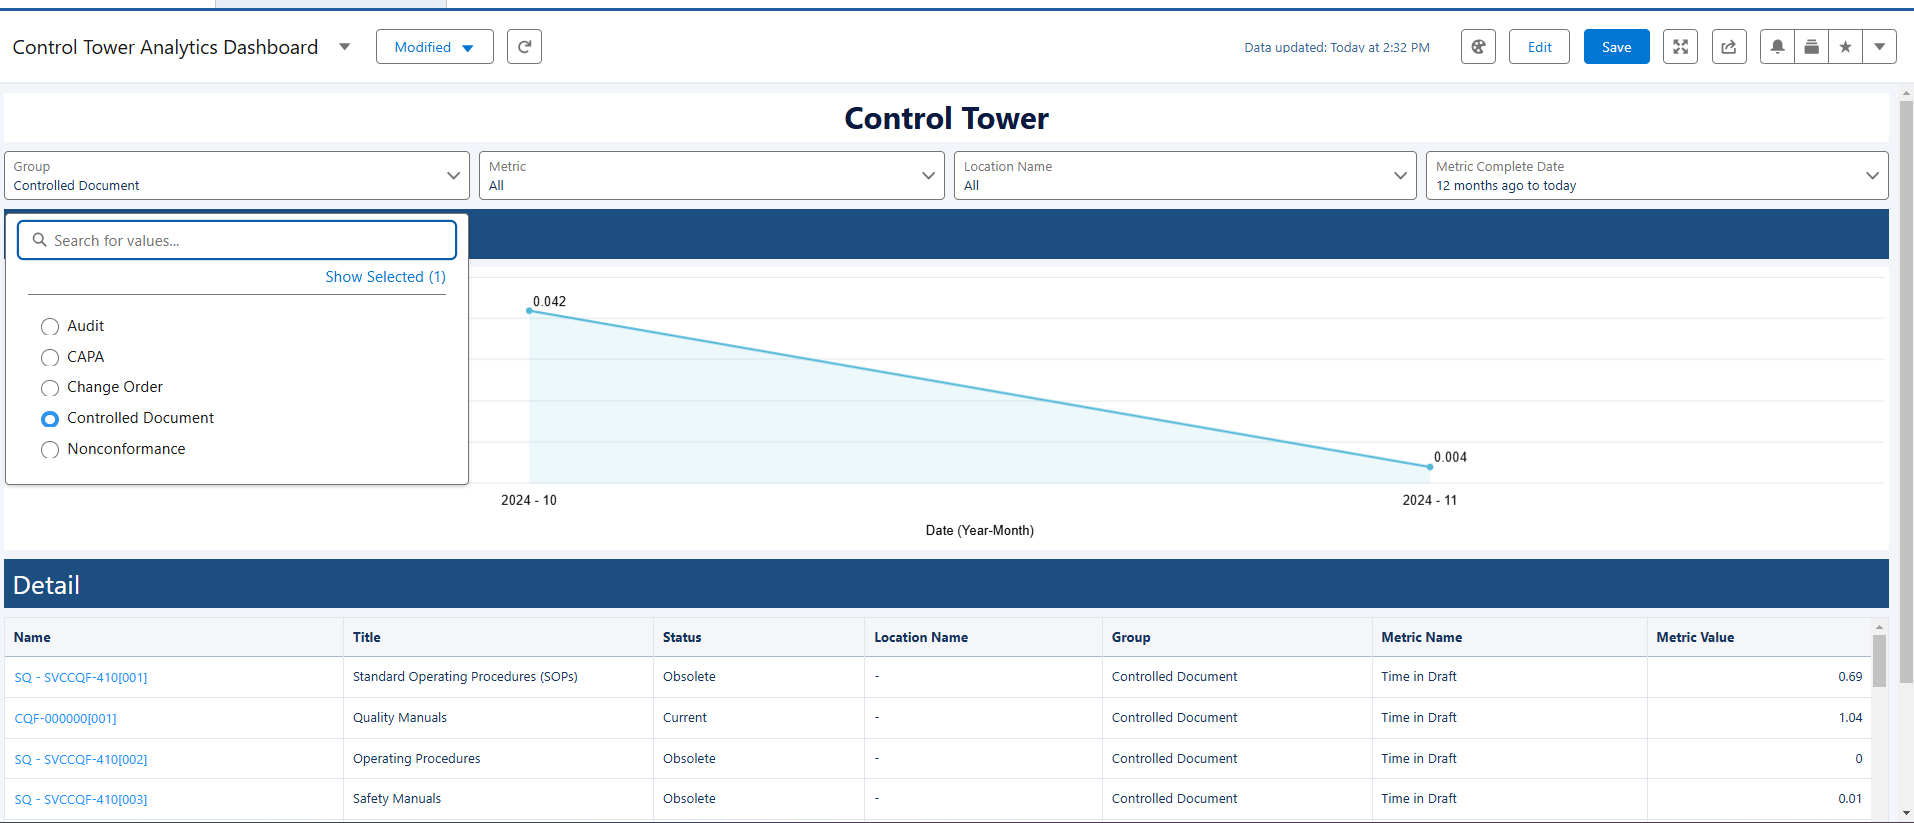
From the Control Tower Analytics Dashboard, click the Group drop‑down arrow.
-
Select an applicable option.
Expected Outcome
-
The Trend Chart shows a line chart of the selected module’s average metric value over time.
-
The Metric drop‑down list updates to display only metrics related to the selected Group module.
-
The Detail section lists records that match the selected module.
Example:
Additional Resources
ComplianceQuest
We Value Your Feedback
To provide feedback or suggestions to improve the help content on this page click here.