
Audience
Standard User
Purpose
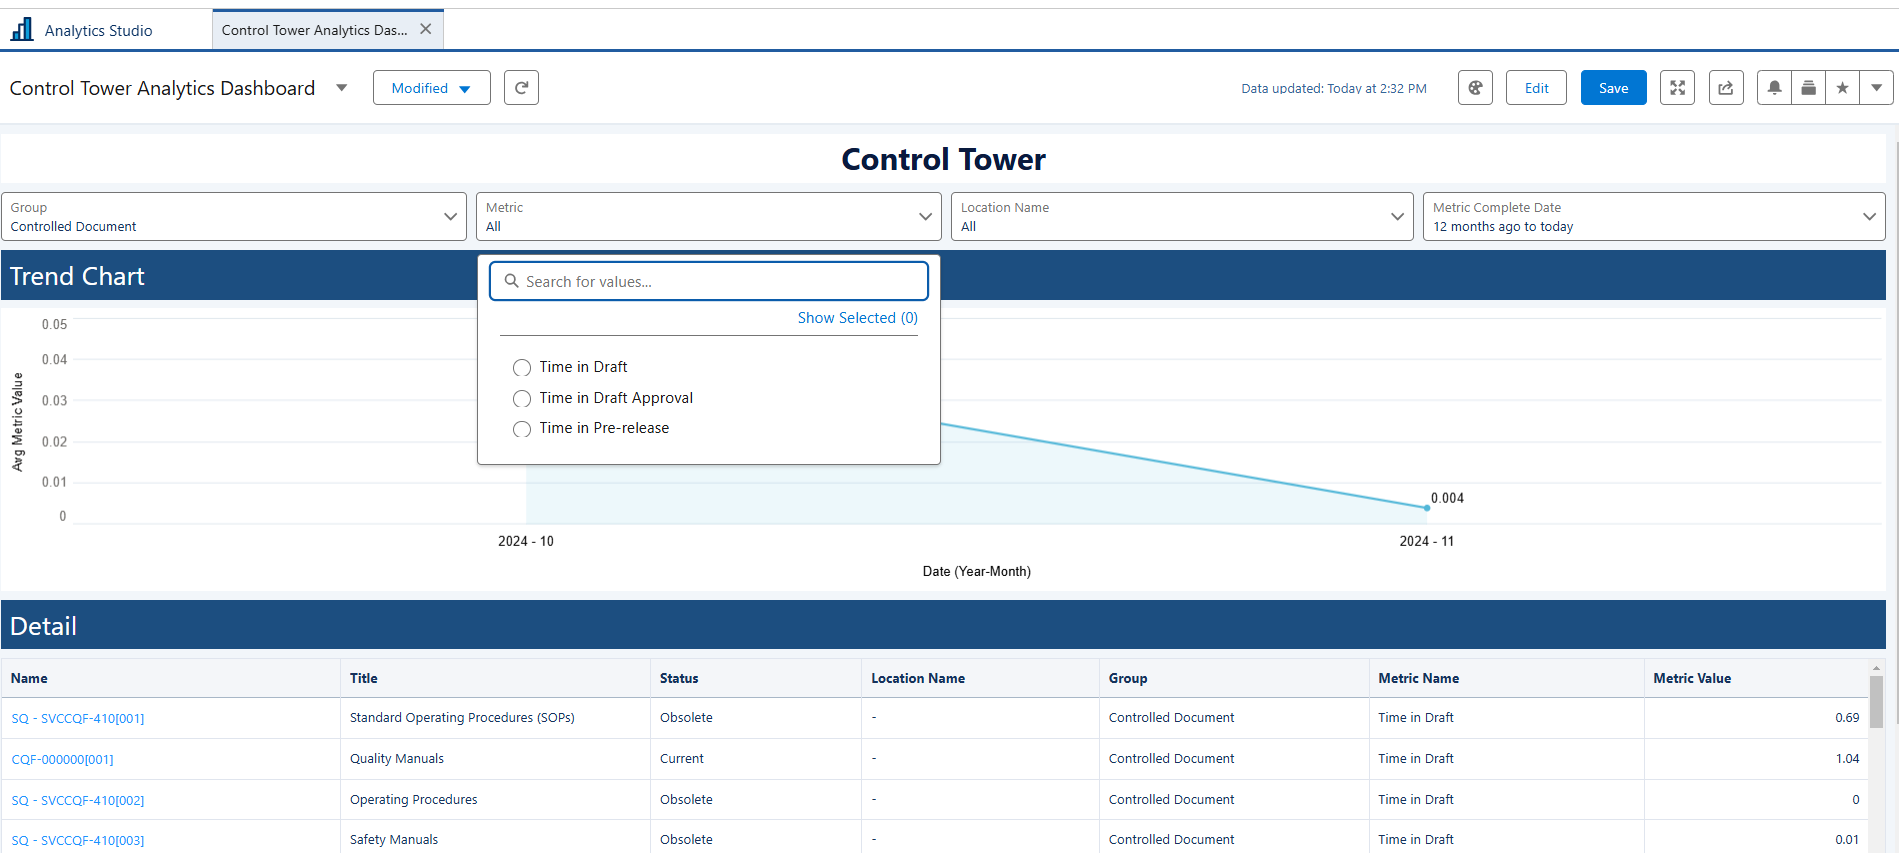
The purpose of the Metric drop‑down arrow is to enable Users to filter and view average metric cycle times based on a specific metric. It ensures that the metric options displayed are relevant to the module selected in the Group drop‑down, providing a contextual and streamlined filtering experience. By selecting a metric from the drop‑down menu, users can immediately display the corresponding average metric cycle time on the dashboard, supporting focused analysis and more accurate performance evaluation.
Prerequisites
Installed Package(s): CQ QMI - Summer 2026
Product: CQ QMI
Function: Creating Rating Models
User Profile: Standard User
Permissions: CQ Base User PSG, CQ QMI Manager PSG
Steps
-
From the Control Tower Analytics Dashboard, click the Metric drop-down arrow.
-
Select any of the applicable options.
Expected Outcome
-
The Trend Chart displays a line diagram illustrating how the selected metric’s average value changes over time, allowing users to easily observe performance trends.
-
The Detail section shows the complete list of records associated with the selected metric, providing users with deeper insight into the underlying data.
Troubleshooting
Optional Configurations
Additional Resources
ComplianceQuest